Use HTML Canvas and TypeScript to make an even faster PI visualizer Part 1


Today, let's learn about HTML Canvas. We'll make a PI visualizer today. Also, check out my previous article in which I used DOM elements. raghavsinghgulia.hashnode.dev/make-a-mathem..
Live Demo
pi-visualizer-with-canvas.netlify.app
Setup
I am using Vite for this project. Start with npm init vite@latest. Then, select vanilla. I'll use TypeScript for this project.
HTML
The boilerplate
<!DOCTYPE html>
<html lang="en">
  <head>
    <meta charset="UTF-8" />
    <link rel="icon" type="image/svg+xml" href="favicon.svg" />
    <meta name="viewport" content="width=device-width, initial-scale=1.0" />
    <title>PI Canvas</title>
  </head>
  <body>
    <script type="module" src="/src/main.ts"></script>
  </body>
</html>
Writing code
Let's first add a canvas with a width and height of 500px
<canvas height="500px" width="500px"></canvas>
Next, let's make a <div> and add an input and button to it.
<div>
      <input
        type="number"
        name="dots"
        id="dots"
        placeholder="Input no. of points"
      />
<button id="button">click</button>
</div>
Finally, let's make h1 which contains the text.
<h1 id="pi"></h1>
Final HTML
<!DOCTYPE html>
<html lang="en">
  <head>
    <meta charset="UTF-8" />
    <link rel="icon" type="image/svg+xml" href="favicon.svg" />
    <meta name="viewport" content="width=device-width, initial-scale=1.0" />
    <title>PI Canvas</title>
  </head>
  <body>
    <canvas height="500px" width="500px"></canvas>
    <div>
      <input
        type="number"
        name="dots"
        id="dots"
        placeholder="Input no. of points"
      /><button id="button">click</button>
    </div>

    <h1 id="pi"></h1>
    <script type="module" src="/src/main.ts"></script>
  </body>
</html>
CSS
Writing code
Let's remove the browser default margin and paddings
*,
*::before,
*::after {
  margin: 0;
  padding: 0;
  box-sizing: border-box;
}
Let's change the font of the h1 to sans-serif.
h1 {
  font-family: sans-serif;
}
Final CSS
*,
*::before,
*::after {
  margin: 0;
  padding: 0;
  box-sizing: border-box;
}

h1 {
  font-family: sans-serif;
}
TypeScript
Selecting all the DOM elements
const canvas = document.querySelector("canvas");
const input: HTMLInputElement | null = document.querySelector("#dots");
const butt: HTMLButtonElement | null = document.querySelector("#button");
const download: HTMLButtonElement | null = document.querySelector("#download");
const pi: HTMLHeadingElement | null = document.querySelector("#pi");
Getting the Canvas data
We want the 2d context here
const ctx = canvas?.getContext("2d");
Working with canvas
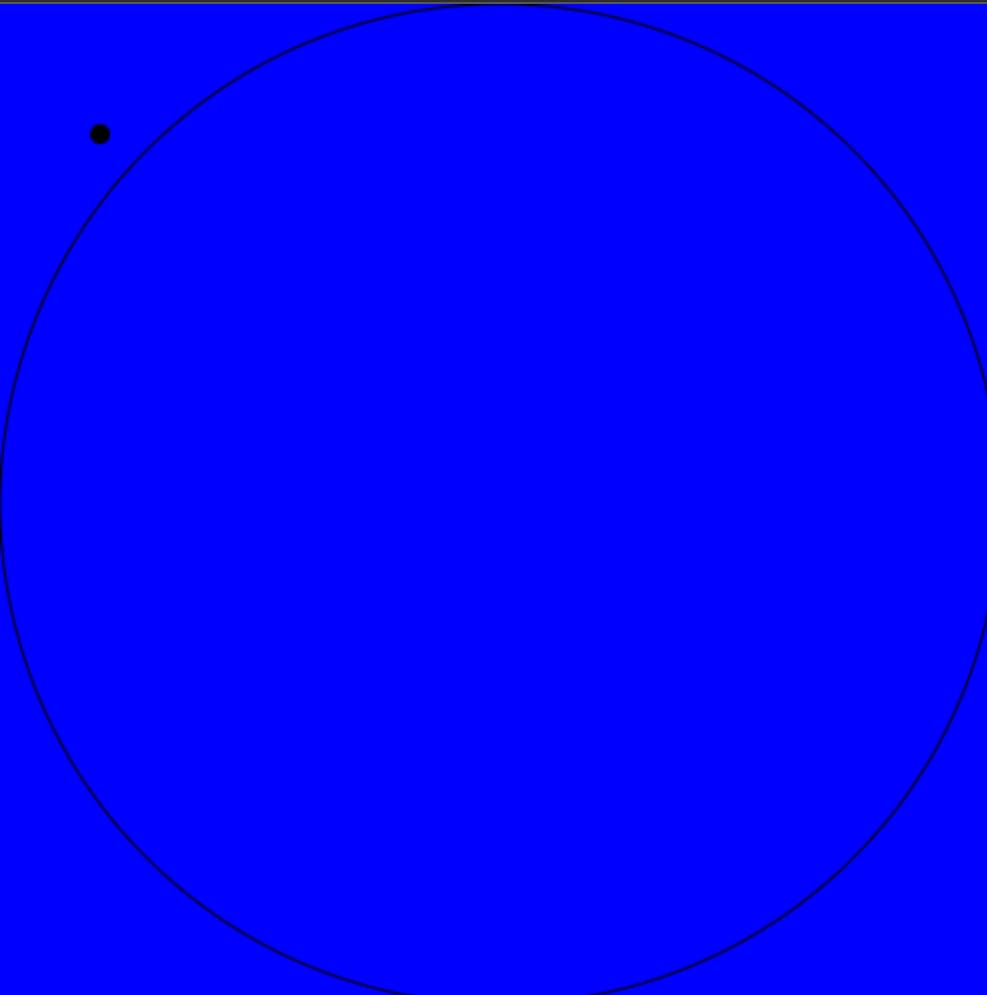
The canvas API can be pretty confusing. Let's first fill the canvas blue. To do that, we'll make a rectangle the height and width of the canvas and fill it with blue. We'll call the function base.
function base() {
    if (!ctx) return;
    if (!canvas) return;
    ctx.fillStyle = "blue";
    ctx.fillRect(0, 0, canvas.width, canvas.height);
}
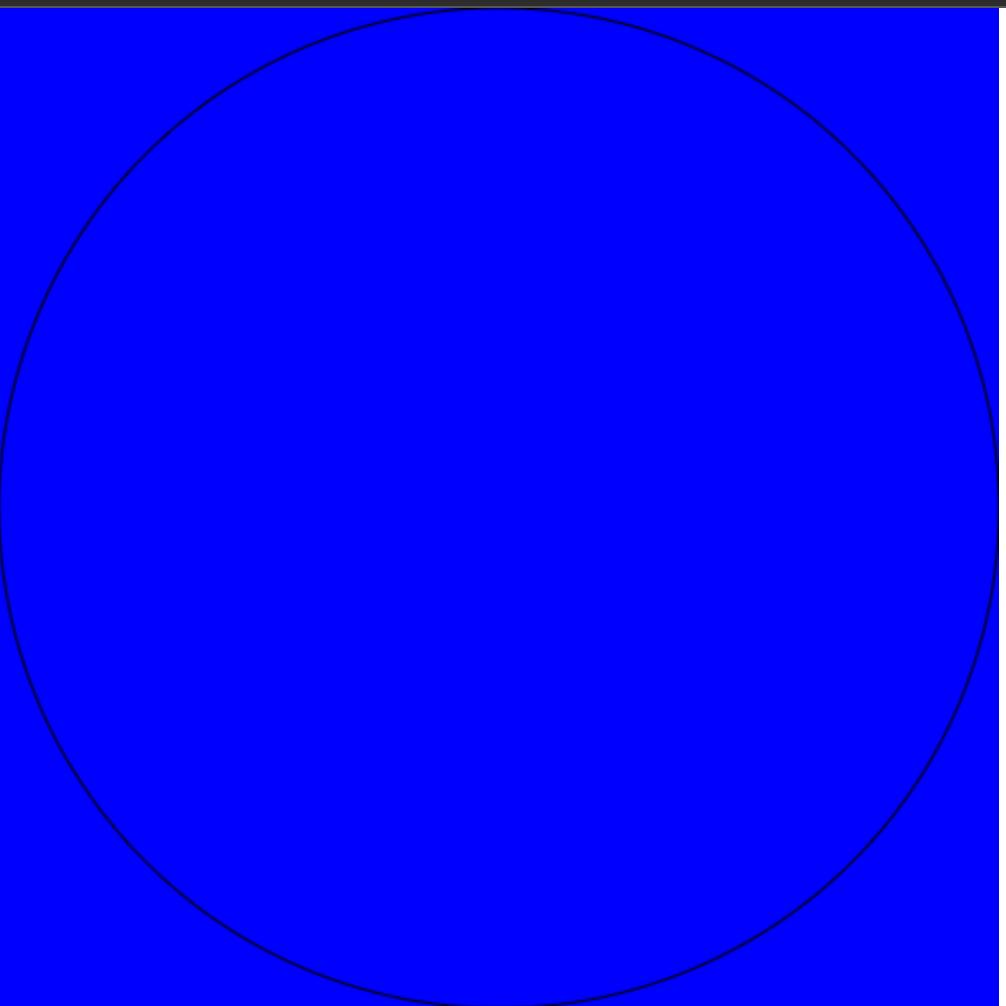
Next, let's draw a circle. We'll first begin the path, make the lineWidth 1 and draw an arc. The parameters are x: number, y: number, radius: number, startAngle: number, endAngle: number. Then, we'll use ctx.stroke() to finish it.
ctx.beginPath();
ctx.lineWidth = 1;
ctx.arc(250, 250, 250, 0, 2 * Math.PI);
ctx.stroke();
Also, don't forget to call the function 😆.
base();
You'll see something like this:
Drawing a dot
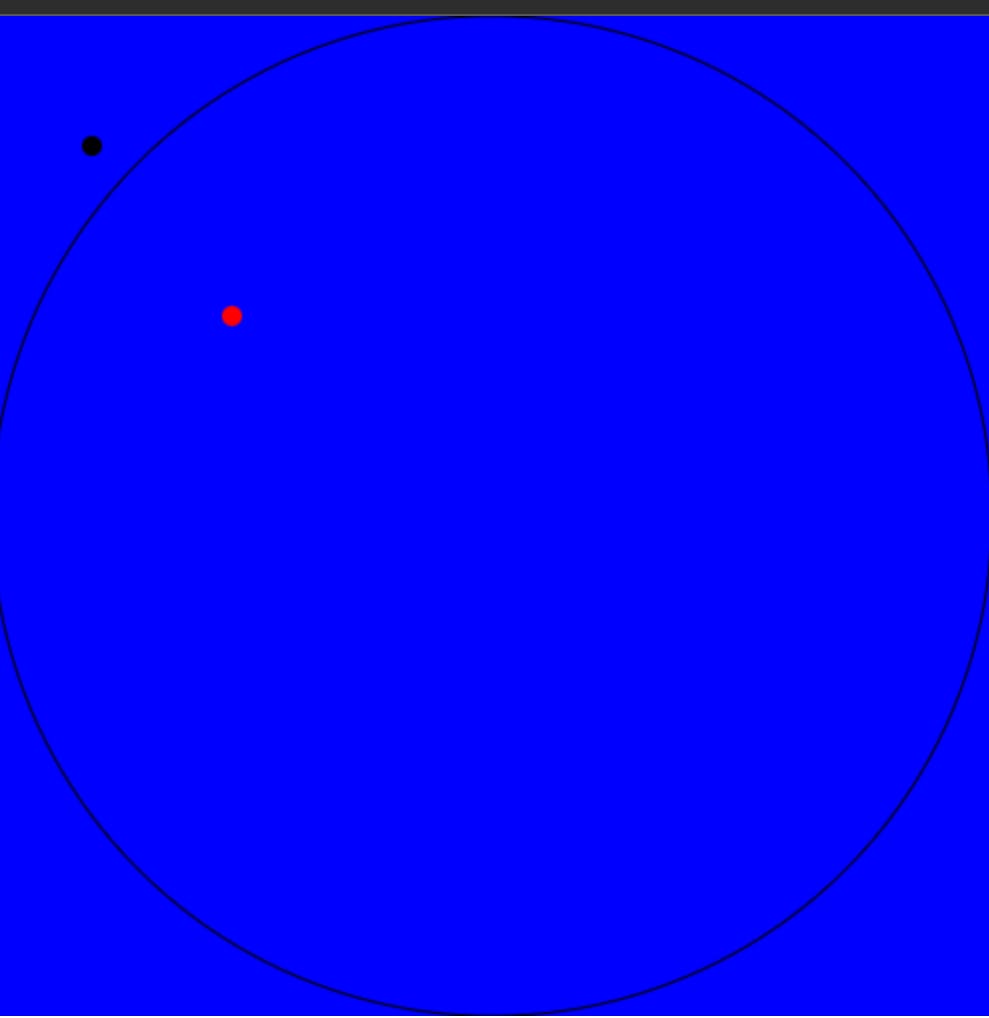
Let's make a function for drawing the dot. It will take an x and a y coordinate and draw a circle there.
function drawDot(x: number, y: number) {
    if (!ctx) return;

    const inside = (x - 250) ** 2 + (y - 250) ** 2 < 250 ** 2;

    ctx.lineWidth = 0.0001;
    ctx.beginPath();

    ctx.arc(x, y, 5, 0, 2 * Math.PI);
    ctx.fillStyle = inside ? "red" : "black";

    ctx.fill();
    ctx.stroke();
  }
Here, we are checking if the dot is inside the circle or not(see this blog post raghavsinghgulia.hashnode.dev/make-a-mathem..) and then
filling it with red or black accordingly. Also, we are setting the lineWidth very small because it can't be 0 (thanks Soundwave). Let's call the function and pass something like (50, 65).
drawDot(50, 65);
Let's call another dot that's inside the circle
drawDot(120, 250);
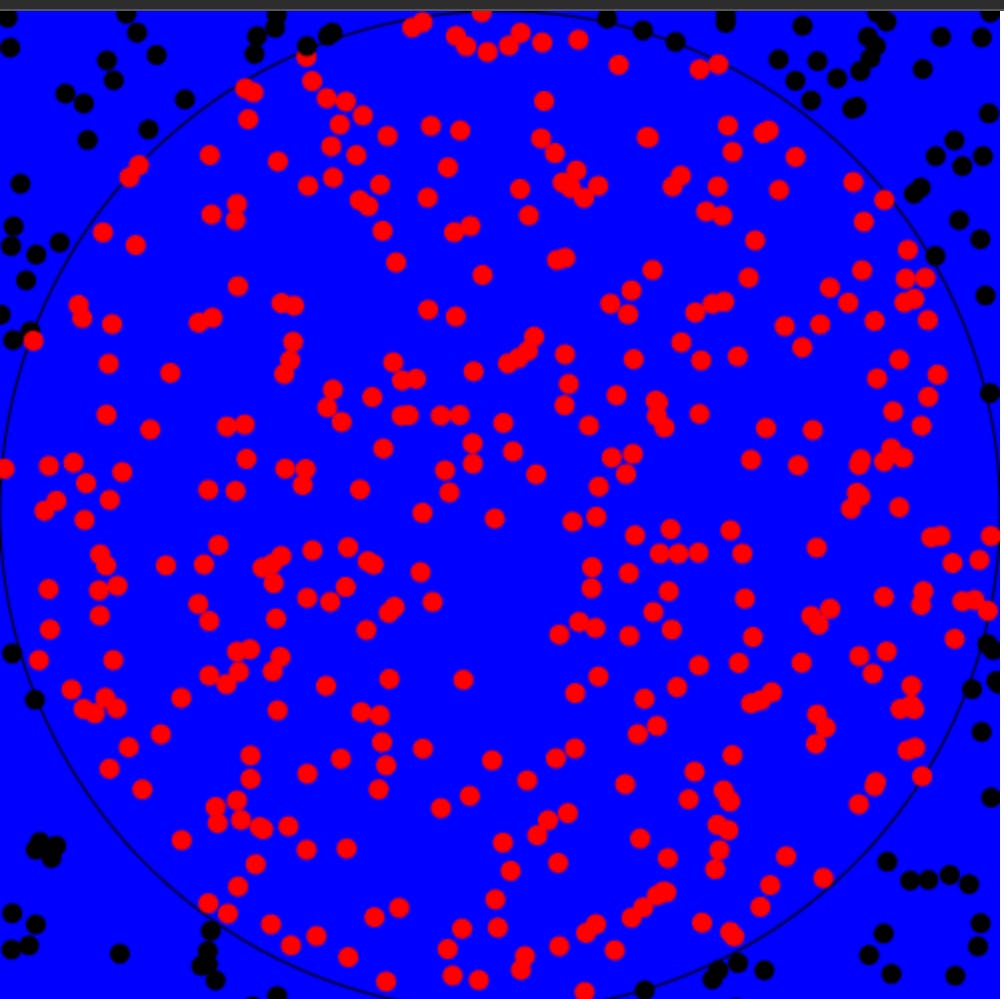
Now let's make a function that draws many dots.
  function drawDots(num: number) {
    if (!pi) return;
    count = 0;
    for (let index = 0; index < num; index++) {
      drawDot(Math.random() * 500, Math.random() * 500);
    }
  }
It takes in an argument num, which is the number of dots he will draw, and then draws them at random positions inside the circle.
drawDots(500);